Interest rate sensitivity II/V: Development scenarios for gold in the context of rising interest rates
The market often takes the view that interest rate hikes put a strain on gold prices. However, looking at past cycles of interest rate hikes contradicts this general view. Part II of our five-part series on the interest rate sensitivity of various asset classes.

At the end of last year, the Bank of England and Norges Bank, among others, began to raise key interest rates. The US Federal Reserve is also expected to initiate an interest rate hike cycle this year as a result of positive labour market data and increased inflation figures. What does this mean for the gold price?
No clear direction
In principle, investors follow the premise that, ceteris paribus, higher interest rates are reflected in rising opportunity costs when holding interest-free gold over bonds. As a result, the price of the yellow precious metal falls. This occurred in 1980, for example. The more restrictive monetary policy at the time – with declining inflation – led to very high real yields, which boosted demand for government bonds and caused the interest-free precious metal to crash.
In contrast, interest rate hikes can spark fears of recession. These, in turn, have the potential to increase demand for gold and thus also its price. This correlation was observed in the interest rate hike cycle from 2004 to 2006. At that time, US economic growth weakened and subsequently triggered fears of recession. Gold accordingly performed strongly as a safe haven during this period.
How interest rate hikes affect gold prices
| Start of the interest rate hike cycle | Gold performance after 260 days (USD) |
|---|---|
| Dec 1976 |
20.8% |
| Sep 1980 |
-34.5% |
| May 1983 |
-12.6% |
| Dec 1986 |
23.0% |
| Apr 1987 |
0.3% |
| Feb 1994 |
-2.7% |
| Jun 1999 |
11.5% |
| Jun 2004 |
10.9% |
| Dec 2016 |
9.9% |
Source: Bloomberg, own calculations
We identified a total of nine US interest rate hike cycles between 1976 and 2021. Figure 1 shows the respective start of these phases (first interest rate hike) and how gold prices developed.
Figure 1: Nine interest rate hike cycles since 1976
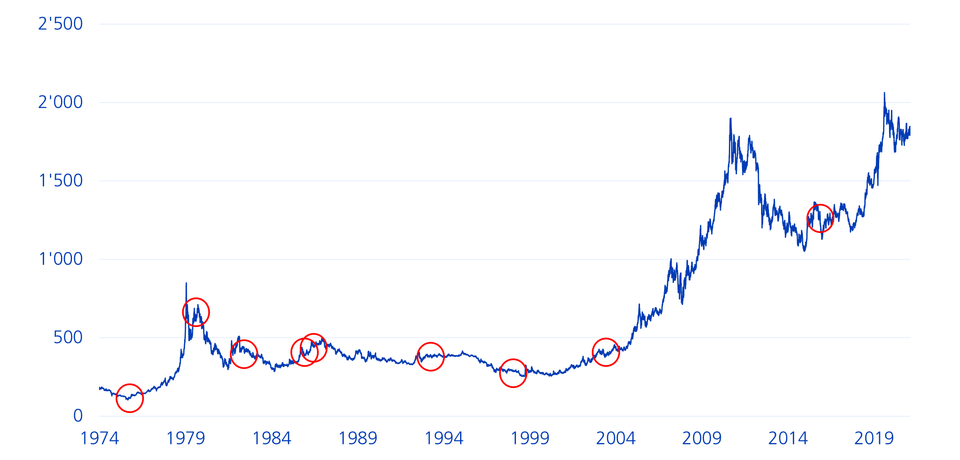
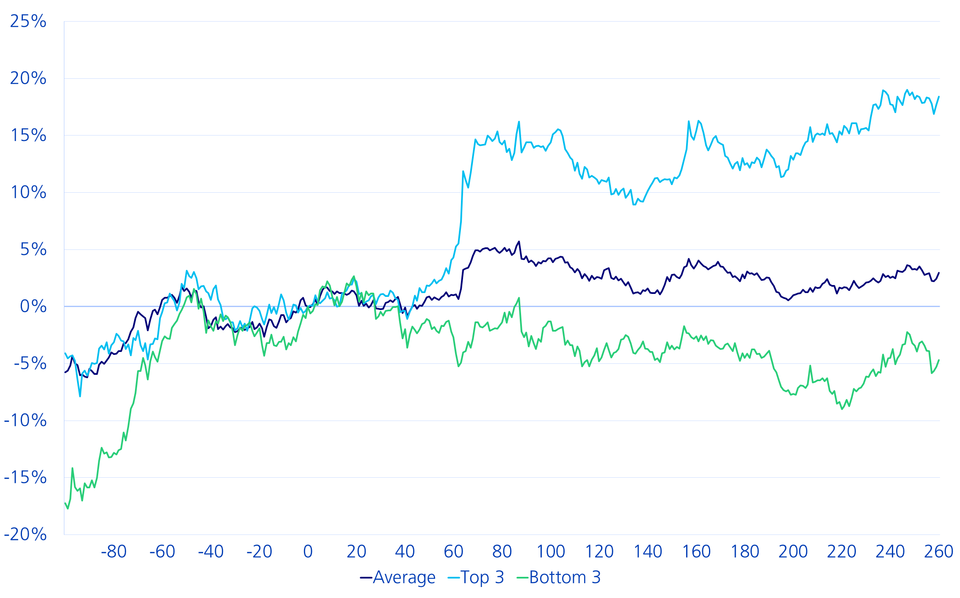
Figure 2 shows the performance of gold up to 100 days before the first interest rate hike and up to 260 days after the first interest rate hike.
Figure 2: Development of gold prices before and after interest rate hikes
Insights for investors
Various insights can be derived from analysing these figures (not exhaustive):
- On average, the price of gold rose in the first year after the start of an interest rate hike cycle.
- The dispersion is high. The three «most successful» cycles show an average performance of almost 20% after the first year. The performance of the three «weakest» cycles was -5%.
- In most cases, the months before the first rate hike were positive for gold.
- It was not possible to maintain a very strong gold performance in the months before the start of the cycle.
For a year now, gold has been trading in a narrow range around the 1800-dollar mark. It will become clear which forces will prevail in the impending interest rate cycle: the negative correlation between real yields and the price of gold or fears of a possible economic slowdown.